


Cartherm – the efficient way of using energy Patented waste heat storage
Cartherm – the efficient way of using energy Patented waste heat storage

Cartherm – the efficient way of using energy Patented waste heat storage
Cartherm – the efficient way of using energy Patented waste heat storage

of internal combustion engines with subsequent use in heating systems and electric cars
Efficient use and processing of unused energy sources are more important than ever. One of these unused sources of energy is the waste heat generated when using internal combustion engines.
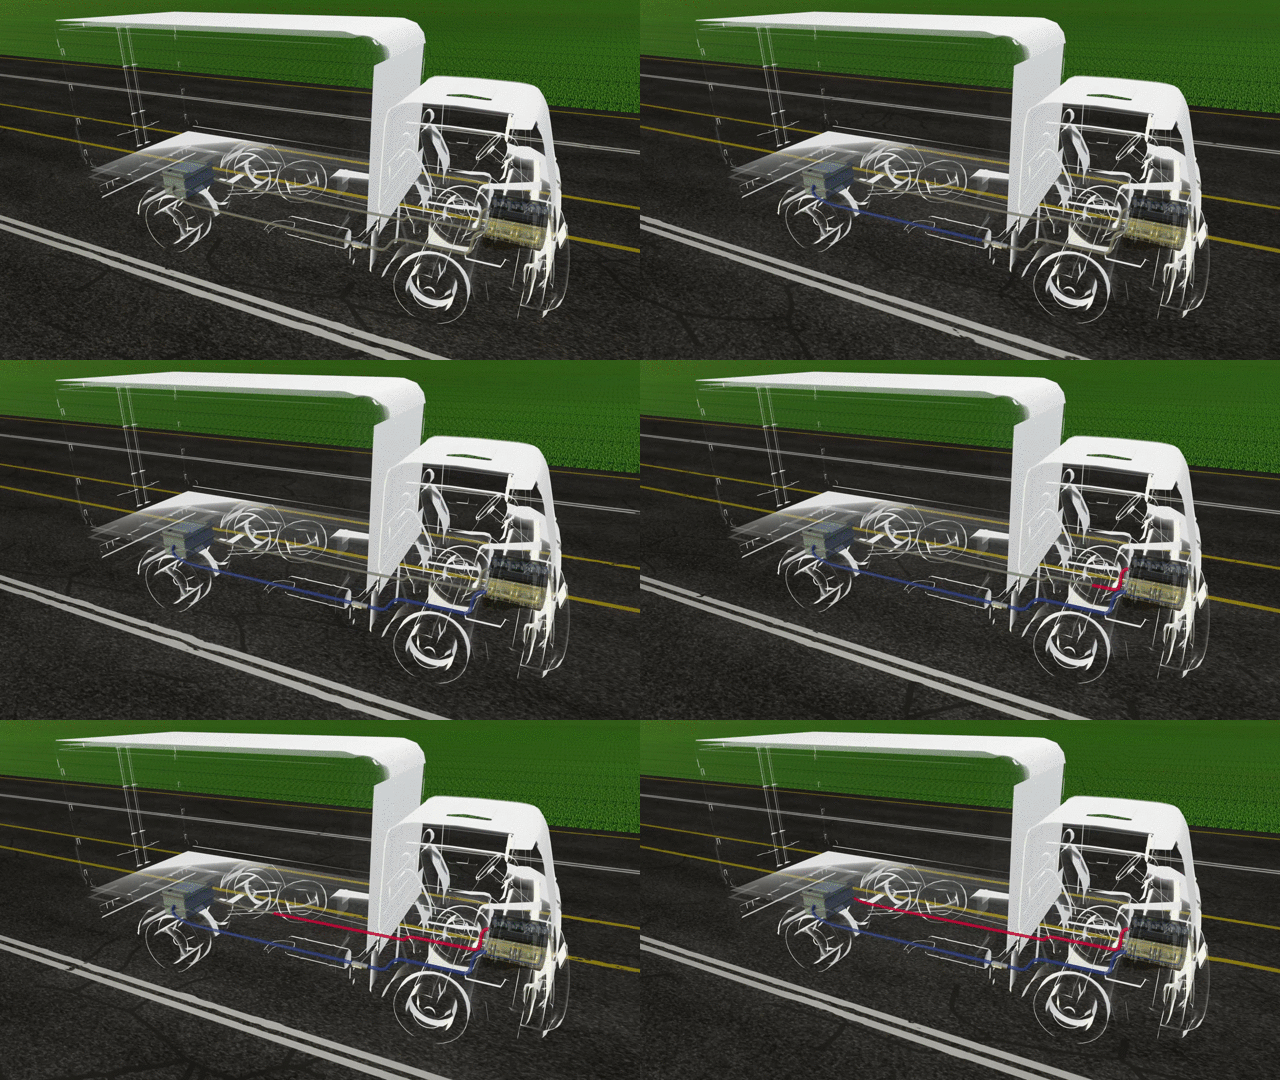
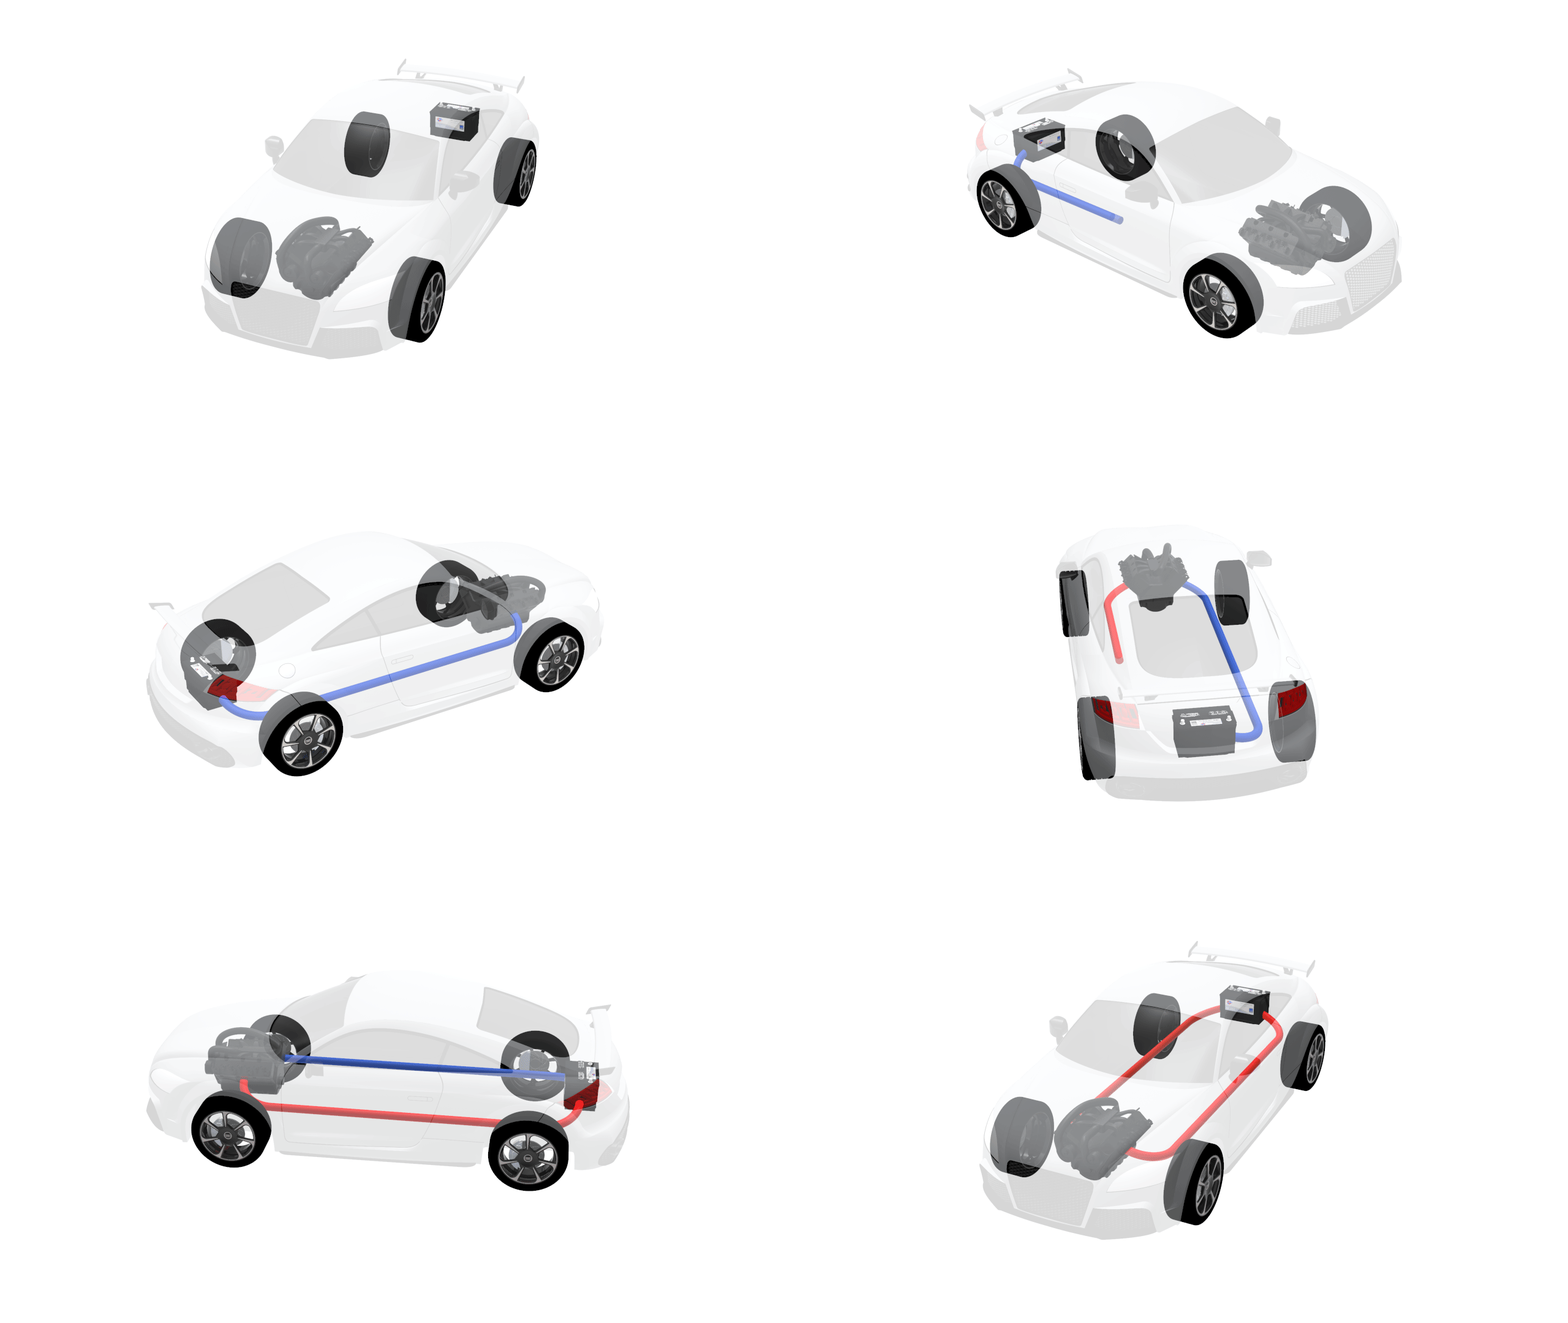
With the patented Cartherm technology, this problem is finally solved! The innovative process enables the waste heat generated to be stored efficiently in a carrier liquid, making it usable as an energy source. The heated carrier liquid can be fed into an external heating system and supports the heating capacity of the system.
Create new possibilities for the effective use of such energy sources and experience the many advantages of Cartherm technology. Not only save on heating costs, but simply use the carrier liquid several times to protect the environment and make the world a better place.
Whether for trucks, buses or the normal family car - Cartherm technology can be used anywhere and helps to make the world more modern and environmentally conscious.

WE ARE AVAILABLE
7:00 – 21:00
DO YOU HAVE A QUESTION?
02368-8792640
Location
Werkstrasse 6
45739 Oer-Erkenschwick

Busunternehmen & ÖPNV
Areas of application

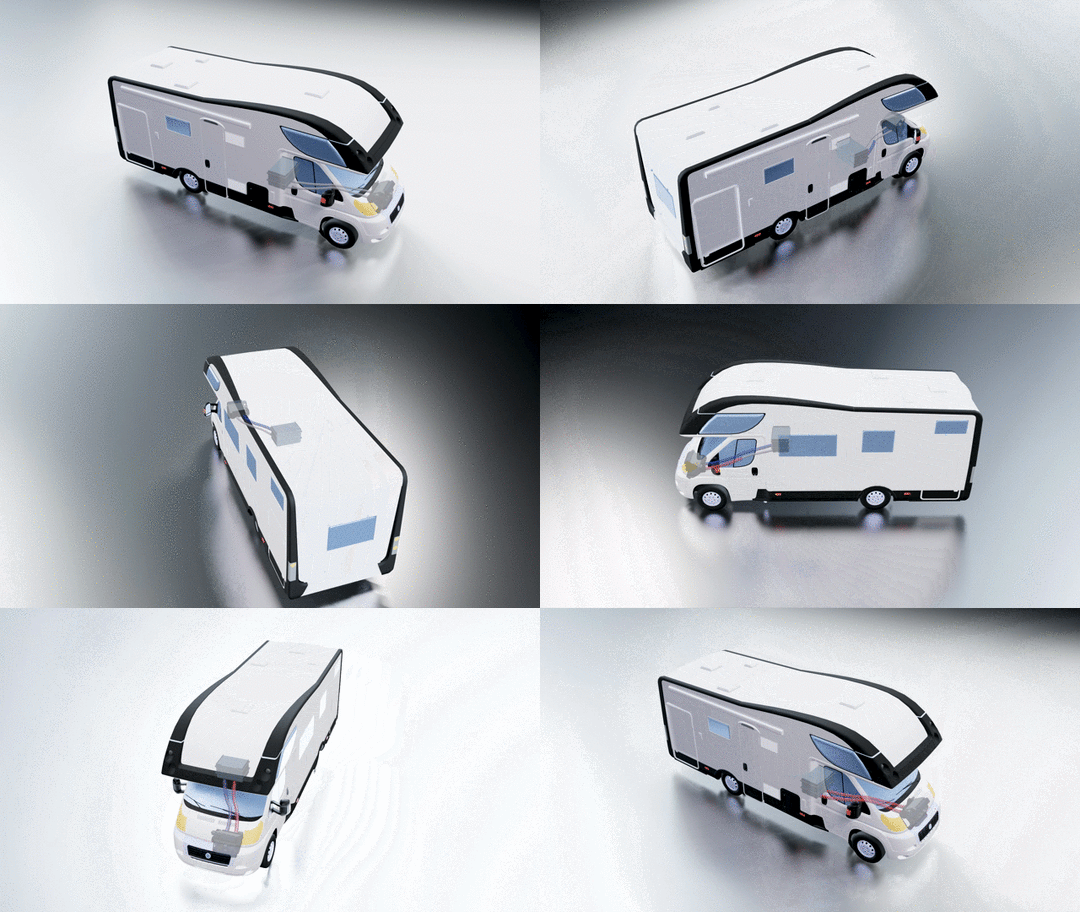
Lines & long-distance coaches & mobile homes
Camper
Areas of application

Liquid exchange directly at the depot
Areas of application
Liquid exchange directly at the depot
Areas of application

Liquid exchange directly at the depot

Areas of application

Preferred areas of application for cartherm
.png)

Areas of application


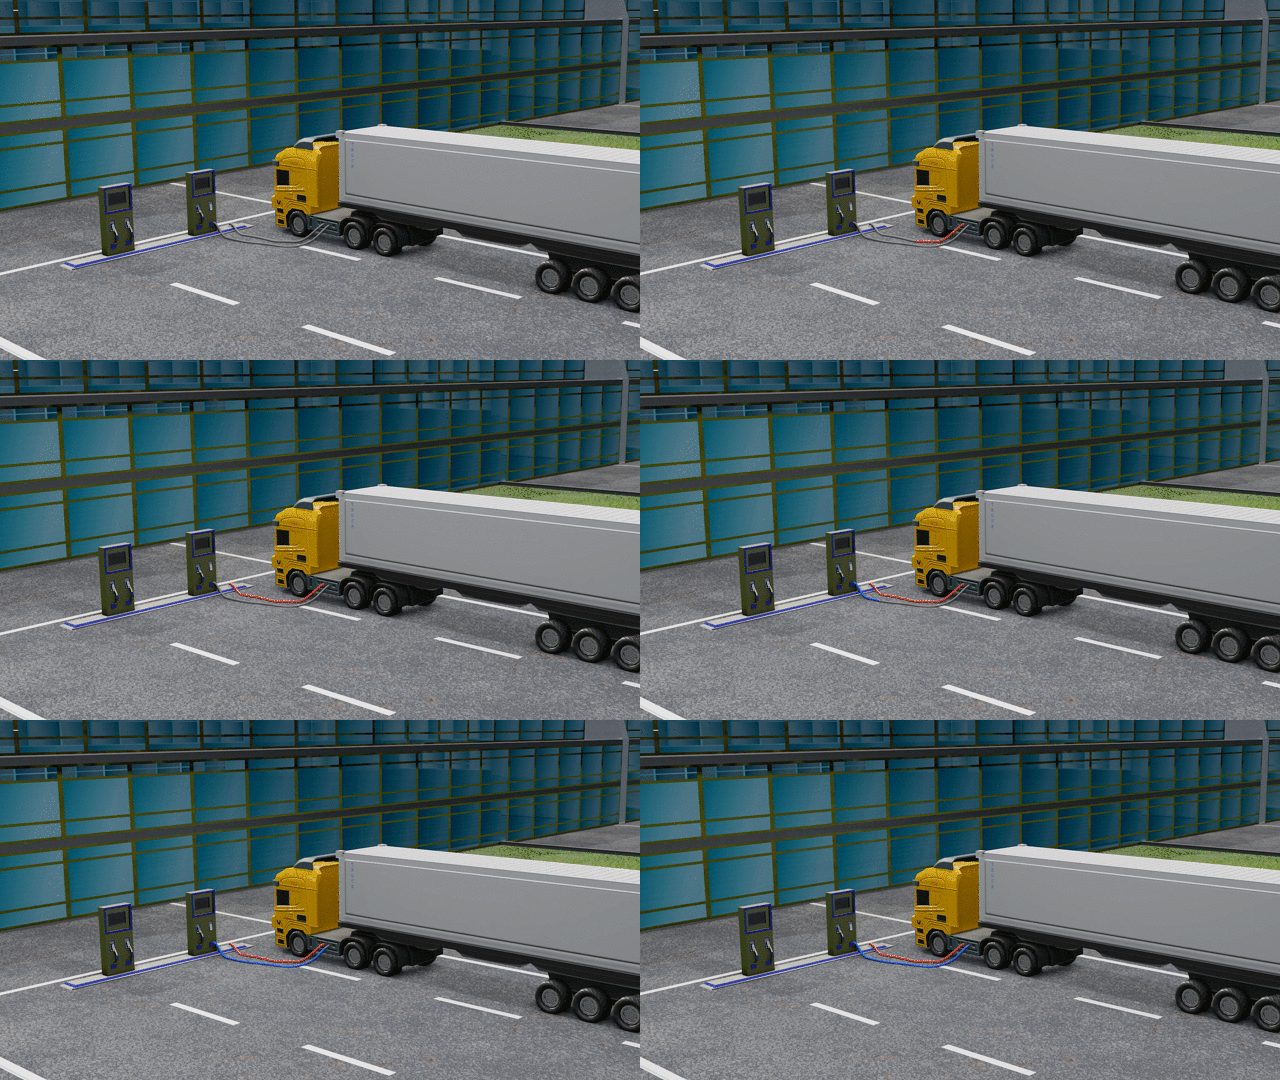
Trucks with Cartherm technology Save CO2 and significantly reduce annual operating costs.
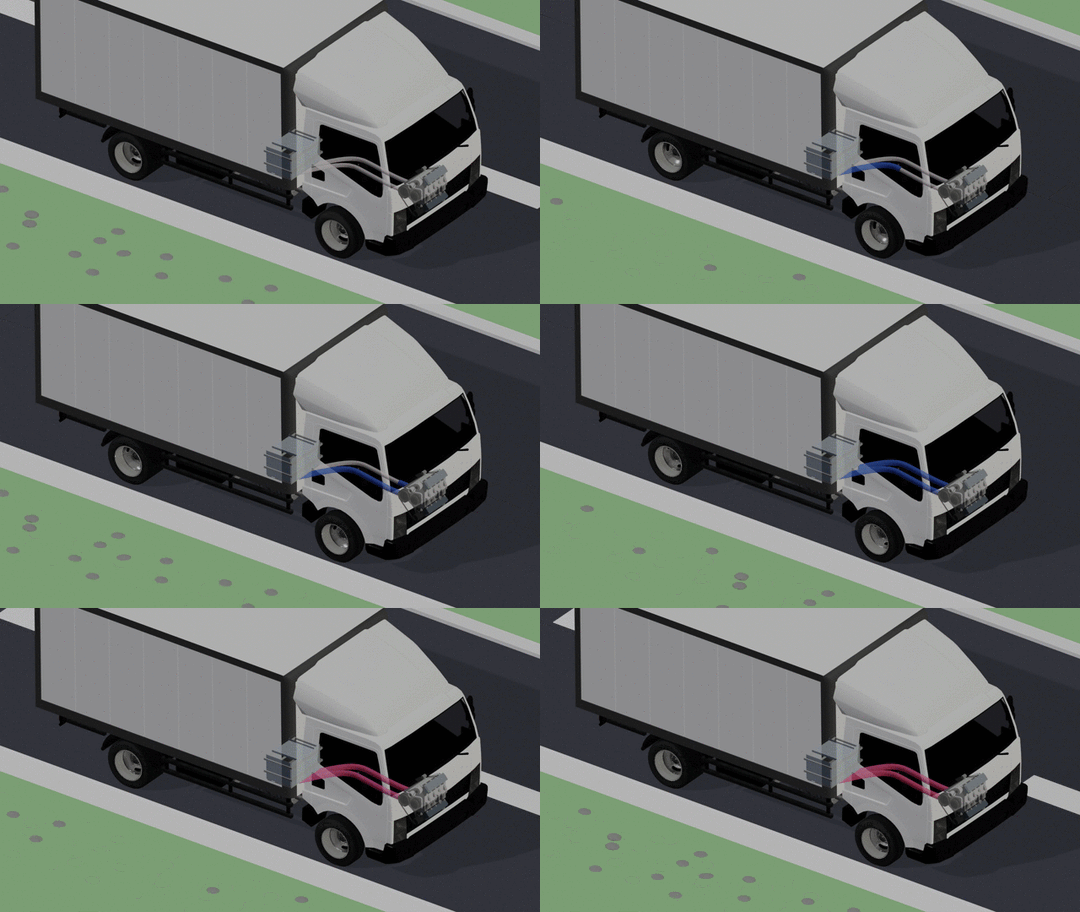
effective & climate-conscious
Areas of application
*further details on request
Liquid exchange directly at the depot
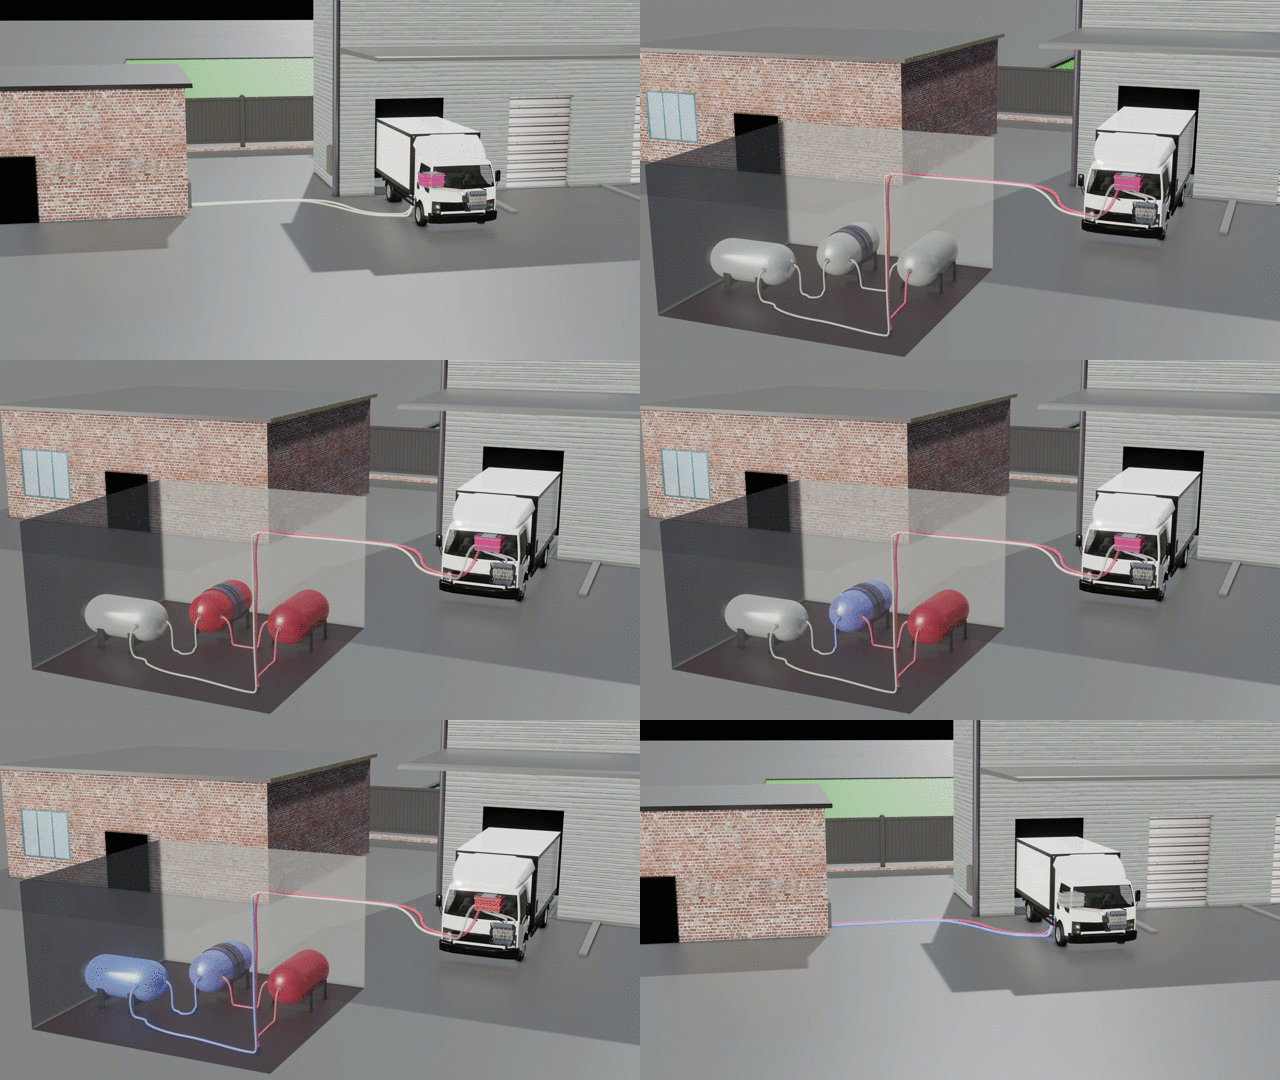
Preferred areas of application for cartherm
Areas of application
Preferred areas of application for cartherm
Areas of application
Invest in an innovative company
According to an ASME report, up to 60% of the heat generated in automobile internal combustion engines is wasted in the form of exhaust gases. An exhaust heat recovery system has already been invented, but this is used to convert the recovered energy into electrical or mechanical energy, which in turn involves considerable losses and complex processes.
Our product, on the other hand, relies on the use of a highly effective heat exchanger to use the thermal energy of the resulting exhaust gases with a simple and at the same time economical method.
This is achieved by a flowing, highly thermally conductive and environmentally friendly liquid storage medium, which is constantly circulating out of the insulated and pressure-resistant tank and is thus kept at any desired high temperature of up to 300°C. The system's ability to maintain a high temperature then helps to use the fluid in numerous heating applications, be it for domestic, industrial purposes and even for the heating system of electric vehicles in winter. The constructive feasibility and economy of our systems is ensured by considering the physically existing parts. The economic feasibility of our product, is ensured by the use of locally available parts from Germany and the simple assembly. In addition, integration can be carried out for almost all vehicles with combustion engines.

Bereit für die Flotte von morgen?
Rüsten Sie Ihre Fahrzeuge um und verwandeln Sie ungenutzte Abwärme in bares Geld. Senken Sie aktiv Ihre jährlichen Betriebskosten und verbessern Sie gleichzeitig die CO2-Bilanz Ihres Unternehmens.
Kontakt/ Anfrage stellen
Sie haben Fragen? Brauchen ein passendes Angebot?
Finanzielle Auswirkungen und ROI-Analyse für energieautarke Lkw-Systeme
Physikalische Energieernte (Referenzmatrix Gigajoule)
Areas of application
Fahrzeugklasse | Speichervolumen (Liter) | Speichervolumen (Liter) | Energie pro Zyklus (GJ) | Energieernte p.a. (GJ) | entspricht kWh |
|---|---|---|---|---|---|
7,5t LKW (S) | 250 | 250 | 0.075 | 75 | 20830 |
12t LKW (M) | 500 | 500 | 0.15 | 150 | 41660 |
40t LKW (L) | 1000 | 1000 | 0.298 | 298 | 82770 |
Infrastruktur-Investition (Umrüstkosten Depot / Abladestellen)
Kostenposition | Erläuterung | Betrag (€) |
|---|---|---|
Wärmetauscher-Einheit | Hochleistungseinheit zur Systemtrennung | 9500 |
Schnellkupplungs-System | Proprietäre Schnittstelle (<2 Min. Andockzeit) | 4800 |
Steuerung & IT | Energiemanagement & Gebäudeleittechnik | 3200 |
Installation & Anschluss | Rohrleitungsbau und Fundamentierung | 5000 |
SUMME PRO DEPOT-STATION | 22500 |
Investitionsstruktur Fahrzeug (CAPEX inkl. Verdienstausfall)
Areas of application
Kostenposition | 7,5t (S) (€) | 12t (M) (€) | 40t (L) (€) |
|---|---|---|---|
Hardware, Montage & IT | 7300 | 10200 | 13200 |
Verdienstausfall (3 Tage) | 1390 | 1720 | 2700 |
Gesamt-Investition (CAPEX) | 8690 | 11920 | 15900 |
Wirtschaftlichkeitsmatrix & ROI (Einzel-LKW Deutschland)
Areas of application
Kennzahl (€/Jahr) | 7,5t (S) | 12t (M) | 40t (L) |
|---|---|---|---|
Brutto-Ertrag (Energie/Heizung/AfA) | 4447 | 8220 | 15120 |
Diesel-Malus (Gewicht) | -926 | -1390 | -2316 |
Netto-Vorteil p.a. | 3521 | 6830 | 12804 |
Amortisationszeit (Jahre) | 2.4 | 1.7 | 1.2 |
10-Jahres-Ertragsprognose (Kumulierter Nutzen Markt DE)
Areas of application
Jahr | Einheiten (kumuliert) | Marktdurchdringung (%) | Nutzen p.a. (Mio. €) | Kum. Nutzen (Mio. €) |
|---|---|---|---|---|
1 | 200 | 0.02 | 1.85 | 1.85 |
5 | 17500 | 1.74 | 171.05 | 319.92 |
10 | 70000 | 6.95 | 683.8 | 2631.12 |
Wirtschaftliche Bewertung des Wärmespeicher-Systems im Bus-Sektor
Thermodynamische Energiematrix (Gigajoule & kWh)
Areas of application
Fahrzeugklasse | Speichervolumen | Energie pro Zyklus | Energieernte p.a. (GJ) | Entspricht kWh |
|---|---|---|---|---|
Linienbus (M) | 500 Liter | 0,150 GJ | 150,0 GJ | ~41.660 kWh |
Reisebus (L) | 1.000 Liter | 0,298 GJ | 298,0 GJ | ~82.770 kWh |
Detaillierte Euro-Nutzwertanalyse pro Fahrzeug (p.a.)
Areas of application
Nutzen-Kategorie | Beschreibung | Betrag p.a. (M) | Betrag p.a. (L) |
|---|---|---|---|
Wärme-Substitution | Sektorenkopplung Depot (13,5 ct/kWh) | 5.624 € | 11.174 € |
Asset-Protection | Verlängerung Motor-Standzeit (Verschleiß -80 %) | 1.250 € | 1.850 € |
Steuervorteil | Gemittelter Effekt aus IAB & Sonder-AfA | 2.100 € | 3.100 € |
Standheizung | Reduktion Brennerstarts/Wartung (marginal) | 850 € | 1.250 € |
Diesel-Malus | Abzug für Systemgewicht (1,2 L/100 km/1 t) | -900 € | -1.390 € |
NETTO-NUTZEN P.A. | Liquiditätsvorteil pro Bus | 8.924 € | 15.984 € |
Detaillierte 10-Jahres-Nutzwertkalkulation (6,95 % Marktdurchdringung)
Areas of application
Jahr | Einheiten neu | Einheiten kumuliert | Marktdurchdringung | Jahresnutzen (Mio. €) | Kumulierter Nutzen (Mio. €) |
|---|---|---|---|---|---|
1 | 100 | 100 | 0,12% | 1,52 € | 1,52 € |
2 | 150 | 250 | 0,31% | 3,81 € | 5,33 € |
3 | 300 | 550 | 0,69% | 8,37 € | 13,70 € |
4 | 450 | 1.000 | 1,25% | 15,22 € | 28,92 € |
5 | 600 | 1.600 | 2,00% | 24,35 € | 53,27 € |
6 | 750 | 2.350 | 2,94% | 35,77 € | 89,04 € |
7 | 850 | 3.200 | 4,00% | 48,70 € | 137,74 € |
8 | 800 | 4.000 | 5,00% | 60,88 € | 198,62 € |
9 | 800 | 4.800 | 6,00% | 73,06 € | 271,68 € |
10 | 760 | 5.560 | 6,95% | 84,62 € | 356,30 € |
Investitions-Zusammenfassung
(CAPEX & ROI)
Kostenposition | Betrag |
|---|---|
Fahrzeug-Umrüstung (CAPEX inkl. Montage) | 12.800 € bis 15.900 € |
Depot-Übergabestation (Infrastruktur) | 22.500 € |
Amortisationszeit (ROI) | ~ 1,1 bis 1,5 Jahre |
Vorteile der Cartherm-Systemklasse für den EU-E-Mobilitätsmarkt
Wirtschaftlichkeits- und Investitionsmatrix
Areas of application
Kostenstelle / Ertrag | Klasse S (250L) | Klasse M (500L) | Klasse L (1.000L) |
|---|---|---|---|
I. Investitionskosten (CAPEX) | |||
System-Hardware & Montage | 6.580 € | 8.810 € | 11.810 € |
Fragoltherm X-76-A (6,50 €/L) | 1.625 € | 3.250 € | 6.500 € |
Inbetriebnahme & Zertifizierung | 1.390 € | 1.390 € | 1.390 € |
Gesamt-Investition | 9.595 € | 13.450 € | 19.700 € |
II. Jährlicher Nutzen (OPEX p.a.) | |||
Energieersparnis (13,5 ct/kWh) | 743 € | 4.100 € | 1.775 € |
Ladezeit-Optimierung (Zeitgewinn) | 13.200 € | 13.200 € | 13.200 € |
Batterie-Werterhalt (SOH-Schutz) | 1.500 € | 1.500 € | 1.500 € |
Gewichts-Malus (Gegenrechnung) | -138 € | -63 € | -245 € |
Netto-Vorteil p.a. | 15.305 € | 18.737 € | 16.230 € |
III. Einmalvorteil Hardware | |||
Einsparung Batterie-Hardware | 4.500 € | 25.800 € | 11.250 € |
Amortisationszeit (ROI) | ~ 0,4 Jahre | Sofort | ~ 0,5 Jahre |
Einschätzung für die ersten 10 Jahre (Ertragsprognose)
Jahr | Einheiten (kumuliert) | Jährlicher Nutzen (Mio. €) | Gesamtnutzen kumuliert (Mio. €) |
|---|---|---|---|
Jahr 1 | 250 | 6,63 | 6,63 |
Jahr 2 | 750 | 16,88 | 23,51 |
Jahr 3 | 2.000 | 44,00 | 67,51 |
Jahr 4 | 4.500 | 95,25 | 162,76 |
Jahr 5 | 8.500 | 171,25 | 334,01 |
Jahr 6 | 14.000 | 269,00 | 603,01 |
Jahr 7 | 21.000 | 388,50 | 991,51 |
Jahr 8 | 30.000 | 543,00 | 1.534,51 |
Jahr 9 | 42.000 | 753,00 | 2.287,51 |
Jahr 10 | 58.000 | 1.033,00 | 3.320,51 |
Investition, ROI und 10-Jahres-Ertragsprognose für Sondermaschinen
Physikalische Energieernte (Referenzmatrix Gigajoule)
Areas of application
Maschinengruppe | Speichervolumen | Energie pro Zyklus | Energieernte p.a. (GJ) | entspricht kWh |
|---|---|---|---|---|
V-Gabelstapler | 200 Liter | 0,058 GJ | 58,0 GJ | ~ 16.111 kWh |
Traktoren / Landw. | 800 Liter | 0,238 GJ | 238,0 GJ | ~ 66.111 kWh |
Baumaschinen (L) | 1.200 Liter | 0,358 GJ | 358,0 GJ | ~ 99.444 kWh |
Erntemaschinen | 1.500 Liter | 0,412 GJ | 412,0 GJ | ~ 114.444 kWh |
Hafentechnik / Spezial | 2.500 Liter | 0,745 GJ | 580,0 GJ | ~ 161.111 kWh |
Investitionsrechnung
(CAPEX & Infrastruktur)
Maschinengruppe | Hardware/Montage | Stillstand | Entladestation | Gesamt-Investition (Netto) |
|---|---|---|---|---|
V-Gabelstapler | 5.800 € | 1.200 € | 22.500 € | 29.500 € |
Traktoren / Landw. | 11.800 € | 2.400 € | 22.500 € | 36.700 € |
Baumaschinen (L) | 14.500 € | 6.500 € | 22.500 € | 43.500 € |
Erntemaschinen | 16.500 € | 8.000 € | 22.500 € | 47.000 € |
Hafentechnik / Spezial | 22.000 € | 15.000 € | 22.500 € | 59.500 € |
Wirtschaftlichkeitsmatrix & ROI
(Einzel-Einheit Deutschland)
Areas of application
Kennzahl (Werte in € p-a) | V-Stapler | Traktor | Bagger | Ernte-M. | Hafen/Spez. |
|---|---|---|---|---|---|
Ertrag Energie (13,5 ct/kWh) | + 2.175 € | + 8.925 € | + 13.425 € | + 15.450 € | + 21.750 € |
Ertrag Asset-Protection | + 650 € | + 1.500 € | + 2.800 € | + 3.200 € | + 4.500 € |
Steuervorteil (IAB) | + 1.200 € | + 2.400 € | + 3.500 € | + 4.000 € | + 5.500 € |
Wartung / Betrieb | - 150 € | - 350 € | - 450 € | - 450 € | - 750 € |
Netto-Vorteil p.a. | + 3.875 € | + 12.475 € | + 19.275 € | + 22.200 € | + 31.000 € |
Amortisation (ROI) | ~ 7,6 J.* | ~ 2,9 J. | ~ 2,2 J. | ~ 2,1 J. | ~ 1,9 J. |
Areas of application
10-Jahres-Ertragsprognose
(Kumulierter Nutzen Markt DE)
Areas of application
Jahr | Markteintritt (pa) | Bestand kumuliert | Ertrag p.a. (Mio. €) | Kum. Ertrag (Mio. €) |
|---|---|---|---|---|
Jahr 1 | 800 | 800 | 10,0 Mio. € | 10,0 Mio. € |
Jahr 2 | 1.600 | 2.400 | 30,0 Mio. € | 40,0 Mio. € |
Jahr 3 | 2.400 | 4.800 | 60,0 Mio. € | 100,0 Mio. € |
Jahr 4 | 7.500 | 12.300 | 153,8 Mio. € | 253,8 Mio. € |
Jahr 5 | 13.000 | 25.300 | 316,3 Mio. € | 570,1 Mio. € |
Jahr 6 | 20.000 | 45.300 | 566,3 Mio. € | 1.136,4 Mio. € |
Jahr 7 | 25.000 | 70.300 | 878,8 Mio. € | 2.015,2 Mio. € |
Jahr 8 | 30.000 | 100.300 | 1.253,8 Mio. € | 3.269,0 Mio. € |
Jahr 9 | 32.000 | 132.300 | 1.653,8 Mio. € | 4.922,8 Mio. € |
Jahr 10 | 31.700 | 164.000 | 2.050,0 Mio. € | 6.972,8 Mio. € |
Sektor: RAIL (Diesel-Rangierlokomotiven)
Investition (CAPEX) und Wirtschaftlichkeit pro Lok
Posten | Details | Wert in € |
|---|---|---|
Hardware & Umrüstung | 5.000L System | 85.000 € |
Erstbefüllung Fluid | 5.000L × 6,50 € | 32.500 € |
Abladestelle, Infrastruktur | Depot-Anbindung | 65.000 € |
Zertifizierung & Abnahme | EBA / Audit | 12.500 € |
GESAMT-INVESTITION, CAPEX | Einmalig | 195.000 € |
Ertrag Energie p.a. | 413.888 kWh × 0,135 | 55.875 € |
Zusatz-Vorteil CO2-Handel | ETS-Zertifikate | 11.009 € |
Asset-Protection | Verschleißschutz | 25.000 € |
Betriebskosten | Wartung | - 1.500 € |
NETTO-VORTEIL P.A. | Cashflow | 90.384 € |
AMORTISATION, ROI | In Jahren | ~ 2,1 J. |
10-Jahres-Plan RAIL (Markt DE)
Jahr | Zuwachs | Bestand kumuliert | Ertrag p.a. (Mio. €) |
|---|---|---|---|
Jahr 1 | 10 | 10 | 0,90 Mio. € |
Jahr 2 | 20 | 30 | 2,71 Mio. € |
Jahr 3 | 20 | 50 | 4,52 Mio. € |
Jahr 4 | 30 | 80 | 7,23 Mio. € |
Jahr 5 | 40 | 120 | 10,85 Mio. € |
Jahr 6 | 50 | 170 | 15,37 Mio. € |
Jahr 7 | 50 | 220 | 19,88 Mio. € |
Jahr 8 | 60 | 280 | 25,31 Mio. € |
Jahr 9 | 60 | 340 | 30,73 Mio. € |
Jahr 10 | 60 | 400 | 36,15 Mio. € |
SUMME 10 JAHRE NUTZEN | 153,65 Mio. € |
Sektor: MARITIME (Binnenschifffahrt)
Investitions-Analyse (CAPEX) pro Schiff
Posten | Schiff M, 10k L | Schiff L, 15k L |
|---|---|---|
Hardware & Umrüstung | 145.000 € | 185.000 € |
Erstbefüllung, 6,50 €/L | 65.000 € | 97.500 € |
Abladestelle, Hafen | 85.000 € | 85.000 € |
Zertifizierung | 15.000 € | 15.000 € |
GESAMT-INVESTITION | 310.000 € | 382.500 € |
Jährliche Wirtschaftlichkeit (ROI) pro Schiff
Kennzahl | Schiff M | Schiff L |
|---|---|---|
Ertrag Energie, 0,135 | 111.750 € | 167.625 € |
Zusatz-Vorteil CO2, ETS | 22.019 € | 33.028 € |
Asset-Protection | 35.000 € | 50.000 € |
Betriebskosten | - 2.500 € | - 3.500 € |
NETTO-VORTEIL P.A. | 166.269 € | 247.153 € |
AMORTISATION, ROI | ~ 1,8 J. | ~ 1,5 J. |
10-Jahres-Plan MARITIME (Markt DE)
Jahr | Zuwachs | Bestand kumuliert | Ertrag pa (Mio €) |
|---|---|---|---|
Jahr 1 | 10 | 10 | 2,07 Mio. € |
Jahr 2 | 30 | 40 | 8,27 Mio. € |
Jahr 3 | 60 | 100 | 20,67 Mio. € |
Jahr 4 | 80 | 180 | 37,21 Mio. € |
Jahr 5 | 120 | 300 | 62,01 Mio. € |
Jahr 6 | 150 | 450 | 93,02 Mio. € |
Jahr 7 | 150 | 600 | 124,03 Mio. € |
Jahr 8 | 150 | 750 | 155,03 Mio. € |
Jahr 9 | 150 | 900 | 186,04 Mio. € |
Jahr 10 | 200 | 1.100 | 227,38 Mio. € |
SUMME 10 JAHRE NUTZEN | 915,73 Mio. € |